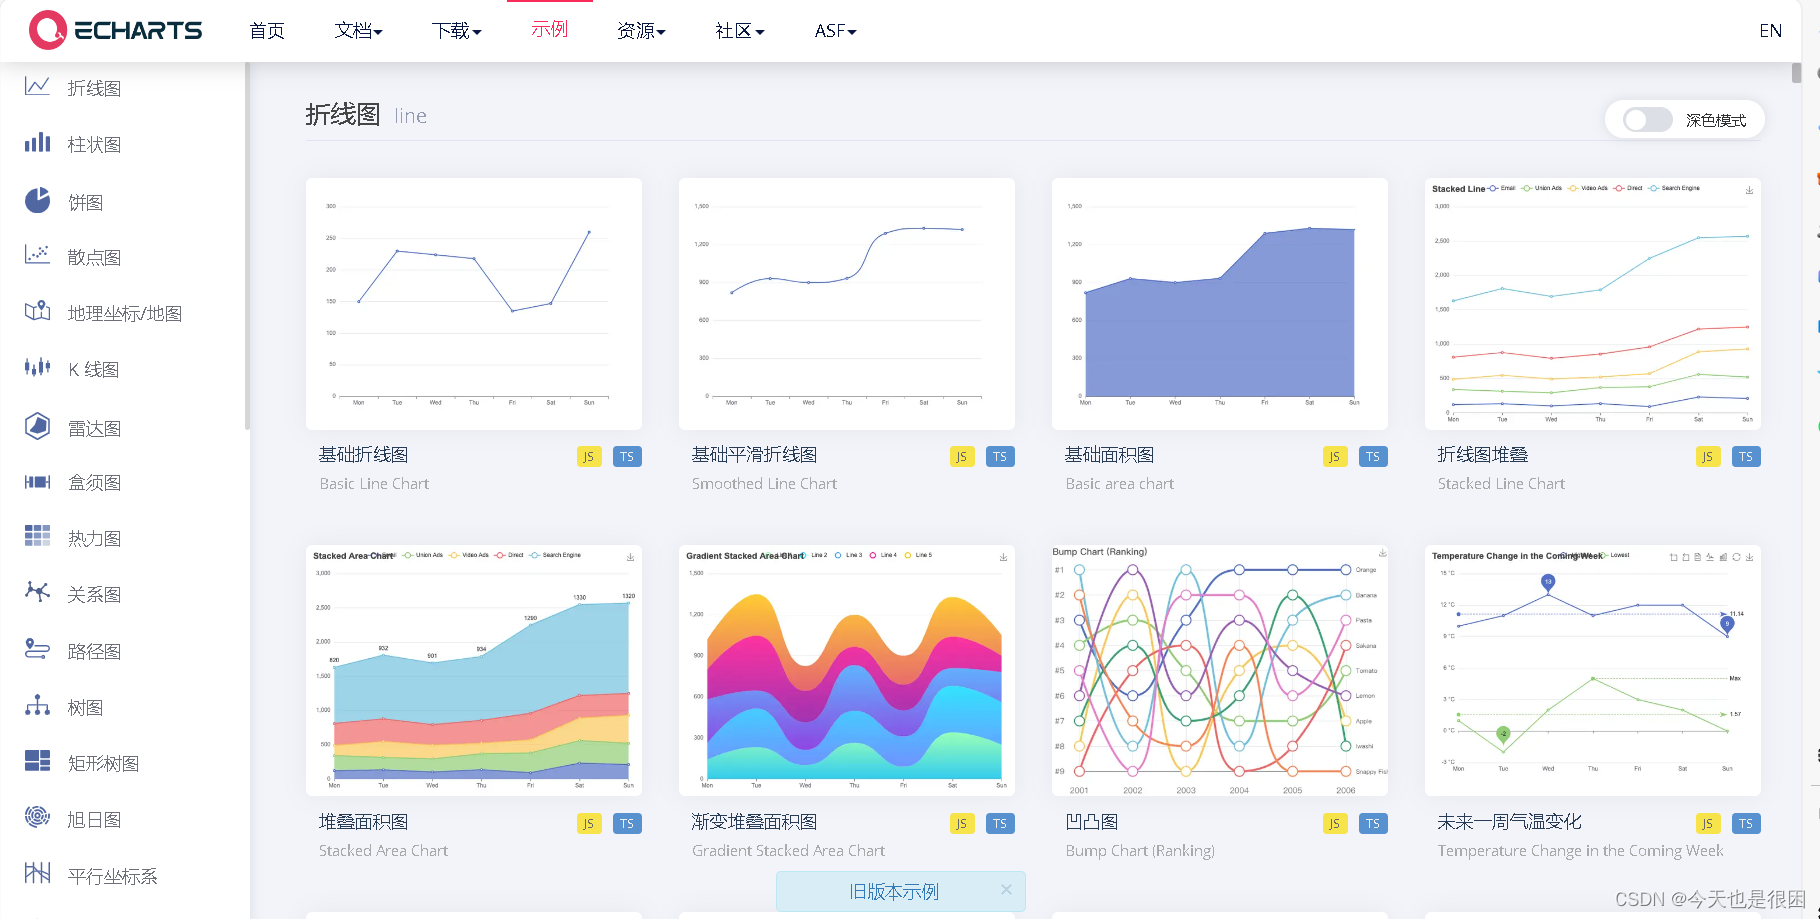
今天介紹一個好用的插件echars,一個可視化插件Apache ECharts
一、使用步驟
1、安裝
npm install echarts --save2、導入
import * as echarts from 'echarts'3、正式使用
echars的使用非常的簡單,直接點擊官網有現成的代碼的可用
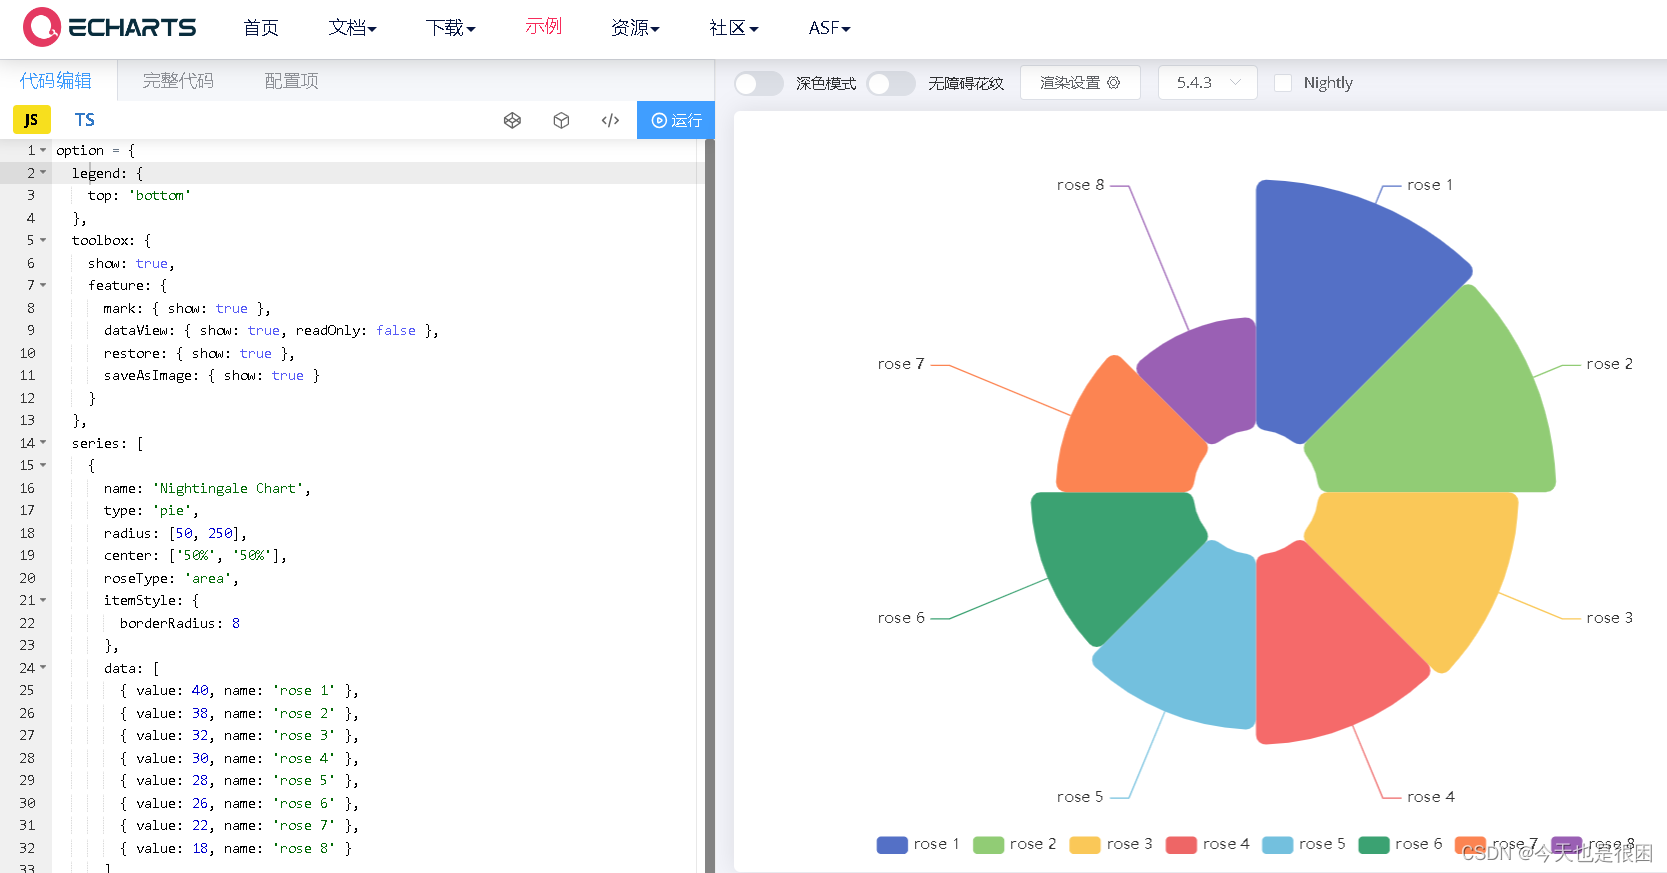
代碼示例
<template><div ref="chart1Ref" :style="{ width: '430px', height: '600px' }"></div>
</template><script setup lang="ts">
import * as echarts from 'echarts'
import { reactive, ref, onMounted } from 'vue'onMounted(() => {init()
})
const chart1Ref = ref()const init = () => {useEcharApi().then(res => {var myChart = echarts.init(chart1Ref.value)var option = {legend: {top: 'bottom'},
//用于提供一些常用的功能按鈕,方便用戶進行交互和操作toolbox: {show: true,feature: {mark: { show: true },dataView: { show: true, readOnly: false },restore: { show: true },saveAsImage: { show: true }}},
//用于定義圖表的數據系列series: [{name: 'xxx',type: 'pie',radius: [25, 125],data: [{ value: res.data[1], name: 'xxx' },{ value: res.data[2], name: 'xxxx' },{ value: res.data[3], name: 'xxxx' }],center: ['50%', '50%'],roseType: 'area',itemStyle: {borderRadius: 8}}]}
//使圖表根據新的 option 配置進行重新渲染,從而呈現出最新的圖表效果option && myChart.setOption(option)})
}</script>
上述代碼后端穿入的為一個map集合的三條記錄,最終的數據依據自己想要展示的不同進行改變。


ChatGPT OpenAI API 免代理調用方式(通過 Cloudflare 的 AI Gateway))
實驗四:CSS3布局應用)
 修改文本位置(label) 南丁格爾圖(roseType))


—ndarray屬性》)


方法的傳參和使用)


)

